IoT in D365FO: Architecture and Connected Systems Design
In today’s article we are going to talk about IoT; about IoT connected to D365FO and how to give our ERP a new layer of functionality that allows us to control, monitor, and predict everything related to the connected devices of our business.
What is the Purpose of This Feature?
Clearly nowadays we hear more and more about IoT (Internet of Things) and how to control devices from the cloud, have real-time monitoring, and so on. That is exactly what this functionality is intended to do; to have a working environment with a series of IoT devices (signals, sensors, machines, telemetry data…) that send this information to D365FO and can take actions and draw conclusions based on that data.
Some time ago we saw the launch of this functionality under the name “IoT Intelligence”. Now this functionality has been improved and in turn renamed to “Sensor Data Intelligence”.
What Can We Do With This Feature?
Currently this functionality allows us to analyze 5 different scenarios, although it is expected that the number of these will increase. Previously we could only analyze 3 of them.
Let’s look at them in the following table:
| Scenario | Utility |
|---|---|
| Machine Downtime | Allows analyzing device efficiency by measuring downtime |
| Asset Maintenance | Minimize costs and extend device lifespan |
| Machine Status | Allows analyzing device performance based on their readings |
| Product Quality | Allows comparing readings with value intervals to ensure correct product quality |
| Production Delays | Allows measuring the actual lifecycle against the planned one to notify delays in production actions |
Application examples:
- Production sensor that is responsible for weighing pallets that pass over it. If the weight is higher than expected, that pallet must be rejected.
- Presence reader on a production line to control that production continues to function. If there is a failure in the line we will be notified.
- Measure the utilization time of a device to predict the point at which maintenance will need to be done.
Up to this point we could say we have all the NON-technical information of this functionality. From this point on, all technical aspects of architecture and configuration are analyzed to understand the ins and outs of the system.
How Can I Activate This Functionality?
This new version of the functionality offers us a very important variation in its activation and initial configuration. While in the previous version it was configured through an add-in from the LCS portal; in the current version we do it directly from the D365FO environment.
So we will perform the following actions:
- Go to System administration > Workspaces > Feature management.
- On the All tab, use the Filter field to search for the feature called Sensor Data Intelligence.
- If the Sensor Data Intelligence feature is enabled in your system, select it in the list and then select Disable to disable it. You cannot use this older version of the feature alongside the new version
- Use the Filter field to search for the feature called (Preview) Sensor Data Intelligence.
- Select the feature in the list and then select Enable now to enable it.
Once the functionality is activated, we will configure it:
- We log in to D365FO with an account that has administrator permissions.
- We go to System administration > Configuration > Sensor Data Intelligence > Deploy and connect Azure resources to open the wizard.
- On the Deploy sample IoT solution in Azure page, we select Deploy.
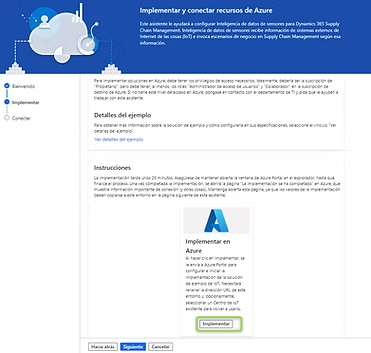
- A new window will open that will redirect us directly to the Azure portal.
- On the Custom deployment page, in the Subscription field, we select the subscription that will host the resources.
- We create a new resource group or reuse an existing one
- We set the following fields: Supply chain management environment URL and Reuse existing Azure IoT Hub unchecked.
- Select Next: Review and create.
Once the resources are created we will perform some final configurations in the D365FO environment.
If we have not closed the wizard, in the next step these fields will appear:
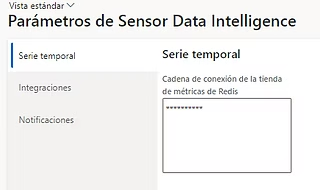
If we have closed the wizard, we just need to navigate to the route System administration > Configure > Sensor Data Intelligence > Sensor Data Intelligence Parameters where we will see a form to configure the same fields.
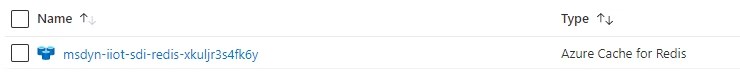
We need 2 pieces of information to fill in these fields. We will go to the Azure portal and within the created resources we will search for 2 of them:
Client ID (Managed Identity)
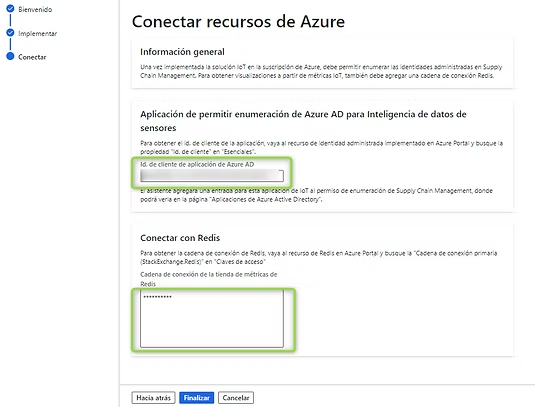
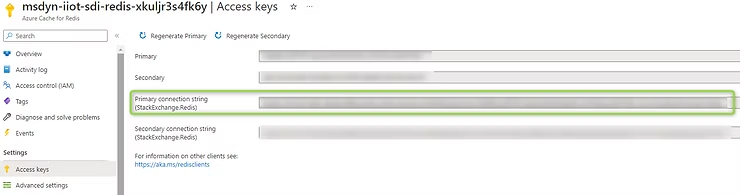
Redis Cache

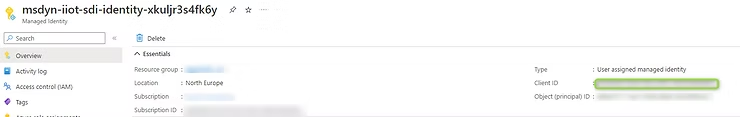
We copy these values and paste each one in its corresponding place.
Once these steps are done, we have the tool properly configured and can use it. But we’re not going to stop here; we’re going to analyze what has happened in this installation process and what elements are involved.
Azure Architecture
In the following image we can see the architecture that will be in Azure once we have implemented the resources mentioned above:
IoT Sensors
First (on the left of the image), we have the physical sensors that will be responsible for sending the information of their readings to an IoT Hub. These readings must be sent in a particular format to Azure and must always be a “sensor-value” pair.
The format will be JSON and will have a structure like the following:
{
    "value": 50,
    "sensorId": "Machine1"
}
In this way the IoT Hub is able to distribute the messages it receives among all created devices.
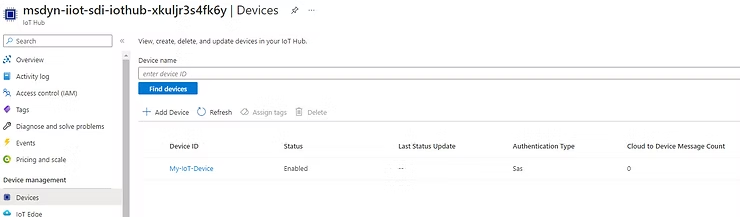
IoT Hub
This resource is responsible for storing and organizing all the IoT devices we have. Conceptually it should host as many IoT devices as real devices we have connected.
For this we go to the “Devices” tab and create as many as we want:
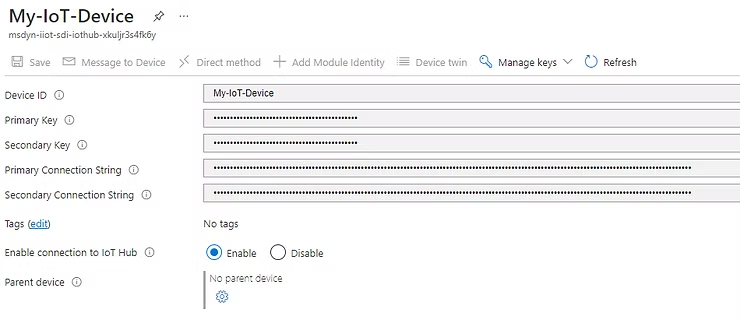
The difference between them is that each one has its connection string, and that is the one we must use to be able to configure the sending of signals.
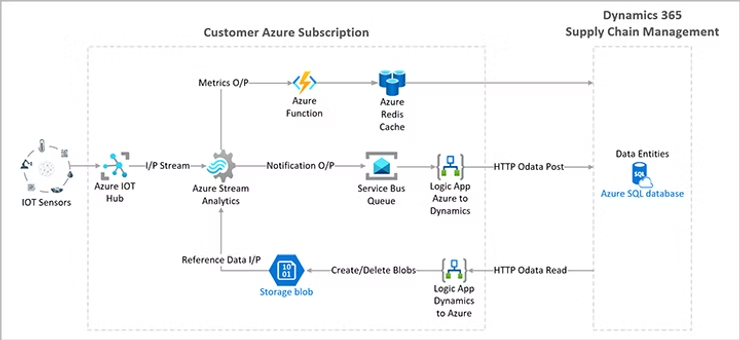
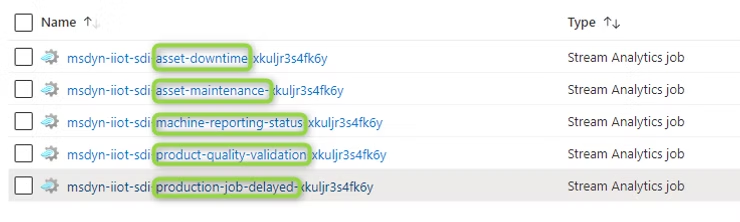
Azure Stream Analytics
These Stream Analytics resources are responsible for performing the following processes:
- The link between the IoT Hub (where device signals reside) and the destination of those signals. In particular, this information has 2 destinations:
- Azure Redis Cache (entry point for metrics to D365FO)
- Service Bus Queue (notification management)
- Receive data from D365FO in order to identify the characteristics and triggers configured in D365FO and be able to execute notifications.
So we can find a Stream Analytics resource for each type of scenario mentioned above.
If we enter one of them, we will see how there are inputs and outputs for these functions, common to all of them.
- Inputs
- IoT Signals
- D365FO Information related to configuration
- Outputs
- Metrics to Redis Cache (to be able to view signals in D365FO)
- Messages to Service Bus (to manage possible notifications)
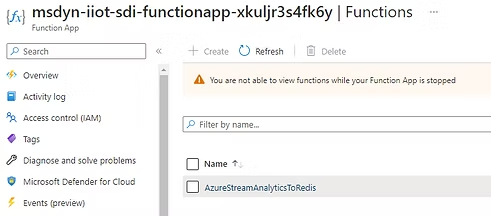
Azure Function
This resource is the simplest of all but the most necessary. It is responsible for the actual transmission of information between the source and destination. It is the channel through which our signals will travel from Stream Analytics to Redis Cache.
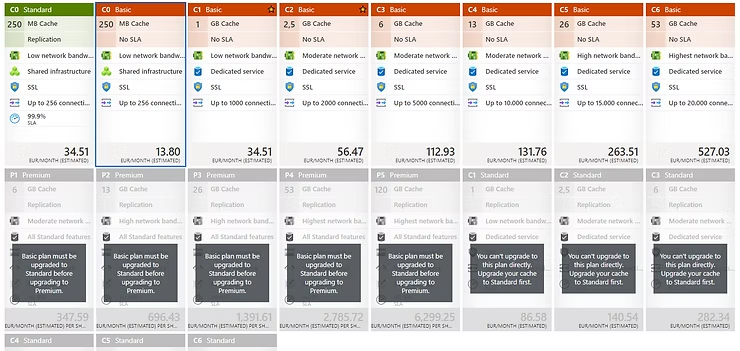
Redis Cache
Azure Cache for Redis is a fully managed, in-memory cache that enables scalable and high-performance architectures. It is used to create cloud or hybrid implementations that handle millions of requests per second with latencies of less than a millisecond, all with the benefits of configuration, security, and availability of a managed service. Therefore, it is extremely useful when we talk about transmission of simple data with very high frequency and need for real-time.
We can configure the size of this cache in this resource and the data lifetime in it. It comes down to a simple “SQL” with automatic deletion.
So it also offers us a wide variety of scalability, as you can see in the following image:
Although obviously it later affects the cost of the resource.
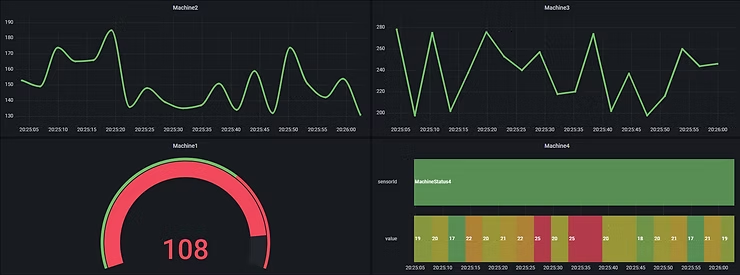
It is in this resource where our IoT data will be stored to be accessible by D365FO. In fact D365FO will make periodic requests to Redis Cache to obtain the data and build the charts.
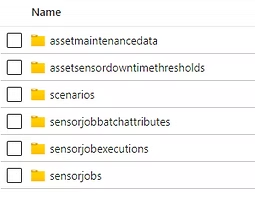
Storage Blob
This resource is nothing more than a storage account where through a Logic App we store the configurations of D365FO so that the Stream Analytics service can later compare the real data with the configurations and be able to generate the alerts.
The content of the storage account is as follows:

As you can see in each folder, the information of each scenario will be stored with the intention that Azure has this data.
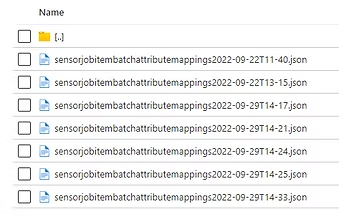
For example, if we configure the product quality scenario, we will have a file similar to this one with the information of that configuration:
The content of one of these files is as follows:
[
 {
 "@odata.etag": "W/\"JzEsNTYzNzE0NjA4MTsxLDY4NzE5NDc2NzYyJw==\"",
 "SensorId": "MachineStatus1",
 "JobId": "005863",
 "JobDataAreaId": "usmf",
 "ItemNumber": "P0111",
 "MaximumAttributeTolerance": 30,
 "OptimalAttributeValue": 25,
 "JobRegistrationStartDateTime": "2022-09-22T02:50:40Z",
 "OrderId": "B000052",
 "IsJobCompleted": "No",
 "MinimumAttributeTolerance": 10,
 "JobRegistrationStopDateTime": "1900-01-01T00:00:00Z",
 "AttributeName": "Concentration"
 }
]
In it we can see the sensor name, the company, the item, the tolerance margins, the associated production order, the attribute we are going to measure…
With this information alone, it is only necessary to make a comparison with the value obtained by the sensor to know if it is outside or within the tolerances.
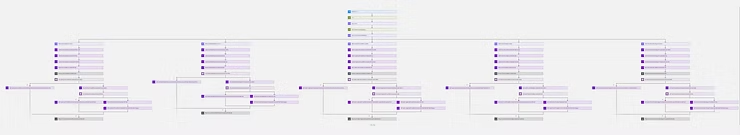
Logic App (transmission of data from D365FO to Azure)
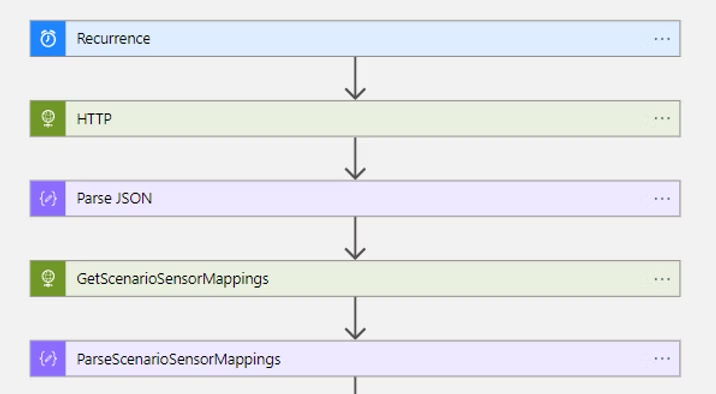
This resource is the most complex to analyze although its function is perhaps quite simple to understand. This logic app is responsible for taking D365FO configurations and transferring them to the storage mentioned above. How does it do it? You just have to take a look at the following diagram to see the complexity of the matter.
Impossible to detect anything in this image so let’s make a spoiler: there’s one branch for each scenario. So let’s focus on just one and then mentally we’ll be able to replicate it for the others.
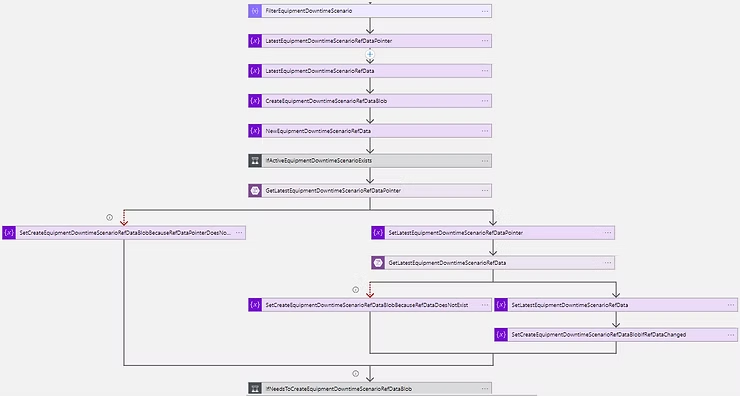
We take the example of the product quality scenario.
First we have a series of requests to gain access to D365FO and return us the list of active and configured scenarios.
Once obtained (common step for all), the flow performs the specific actions for each scenario; in the case of product quality assessment:
Without going into much detail, what this flow does is compare the configurations that exist in Storage and create those that are necessary for the configuration to be current. By default, the lag between configuration updates is 2 minutes, although we can easily modify it.
Service Bus
This service is responsible for queuing all notifications detected by Stream Analytics that need to be sent to D365FO in order.
Logic App (Notifications)
Once we have the notifications in the Service Bus, we need something to transmit these alerts to D365FO. This Logic App is responsible for this.
Through a Post on D365FO it shows us the alerts and marks the messages as completed so that the queue empties and the message is not sent again.
With These Insights, Could I Already Use IoT with D365FO?
Of course the answer is yes. But in this article we have not seen its operation or configuration. For this we invite you to see the following publication where, in addition, there are surprises.
In the following publication we will configure scenarios, we will see how the results are displayed in D365FO, and we will also see how we can add a better visualization layer with external tools. Finally, as mentioned, some surprise will come.